Xavier Quinn
.png?raw=true)
Data analyst
they/them
I love writing stories, listening to music, and researching my family history
View My Tableau Public Profile

Massachusetts Education System Analysis
Why Massachusetts Schools?
My mom was a teacher at a grade school in Pennsylvania for most of my life. I grew up with an inside view of teaching.
I knew that education was a field I was interested in and used to dream of working at a large school. Teaching was not for me and I try to take any chance I get to work with educational data.
I’ve wanted to live in Boston for some time now and being able to analyze data from the Massachusetts school system is an exciting opportunity.
Exploring this dataset and creating visualizations has provided me with informative insights into the educational system and the state of schools in Massachusetts. It’s made me wonder what the status is for other education systems across the United States.
What the Data Says
The Massachusetts school system is made up of hundreds of schools in multiple districts. Each one with its own student ratings and data.
Success for this project is decided by the following:
- A report on the state of the school system
- How does class size affect college admission?
- What are the top math schools in the state?
- What schools are struggling the most?
The analysis concluded with the following insights:
- Springfield District has 3 public schools in the bottom 10
- The top math schools are all public schools
- Larger class sizes mean more students go to college after graduating
- Schools with more disadvantaged students have less students and lower graduation and college rates while schools with more advantaged students have more students and higher graduation and college rates
Data background
This dataset shows many ratings and details from hundreds of school in Massachusetts.
It contains:
- 1,861 rows of schools, their geographic information, and educational ratings
- 298 columns of information for each school recorded
Each row contains information for one school. For instance school name, total enrollment, and average class size.
Those columns include:
- School Name
- School Type
- % Economically Disadvantaged
- % MCAS_4thGrade_Math_P+A
- TOTAL_Enrollment
Bottom 10 Schools
The bottom 10 schools include three from Springfield District. All three are public schools with a graduation rate ranging from 16.7% to 8.7%. Springfield District consists of 10 schools; four have a graduation rate under 50%, the other 6 have a rating over 50%. Springfield High School is 5th in the bottom 10 schools and 88% of its students are economically disadvantaged and only 11.6% go on to college.
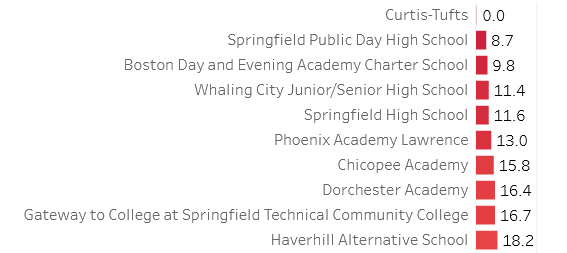
The three public schools in Springfield District are:
- Gateway to College at Springfield Technical Community College: 16.7% graduation rate
- Springfield High School: 11.6% graduation rate and 88% rate of economically disadvantaged students
- Springfield Public Day High School: 8.7% graduation rate
With three schools in the bottom 10, another under 50% graduation rate, and the other six over 50%, Springfield District has several warning signs that it needs extra support and funding.
Best Math Schools
The top 10 math schools are made up of 10 districts, containing 8 schools, all of which are public schools. Each school has a graduation rate of over 90% and the rate of students disadvantaged is below 19%.
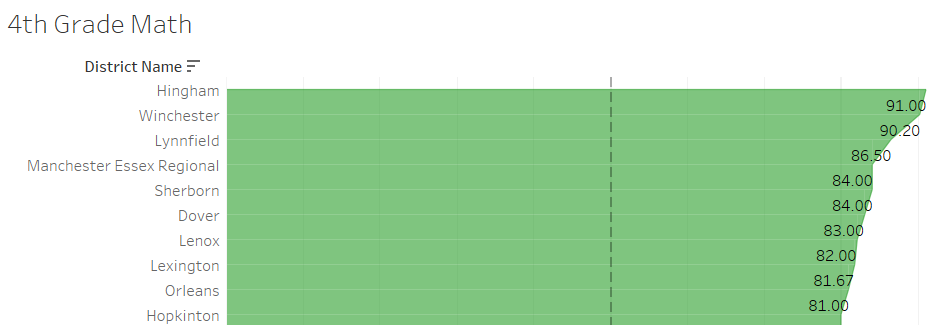
These signs all point to the students doing well academically and financially. The policies and decisions that support these districts should be evaluated for key strategies that result in the high ratings.
Onward to College
College determines success in this society. When a high school doesn’t set up its students for college, their chance of financial independence, quality of life, and thriving goes down. In Massachusetts, there are several schools that show the correlation between class sizes and going to college. Two of these schools are:
- Fecteau-Leary Junior/Senior High School
- Boston Preparatory Charter Public High School
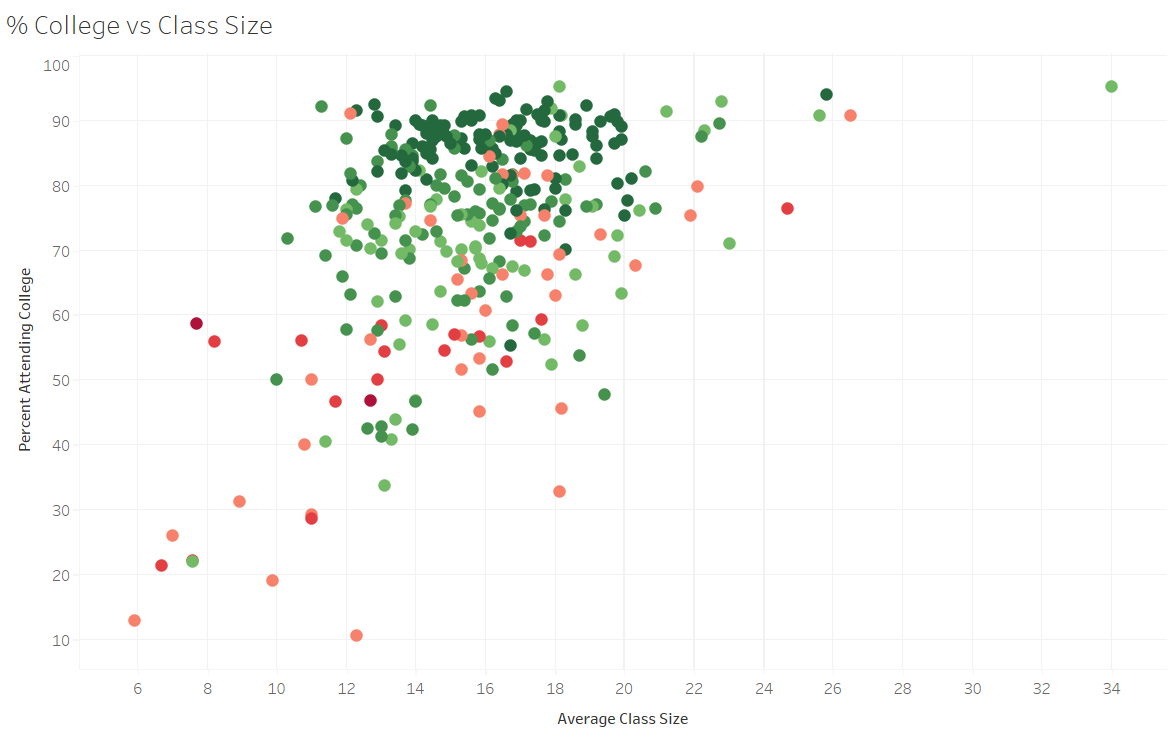
These schools are one the opposite ends of the correlation range. Fecteau-Leary Junior/Senior High School is a public school in the Lynn District. Fecteau-Leary Junior/Senior High School has no passing rate for 4th grade math and 52.3% of its students struggle economically. It has a class size of 12 students and 32% of its students graduate with 10.5% going to college.
Boston Preparatory Charter Public High School is a charter school in the Boston Preparatory Charter Public District. Boston Preparatory Charter Public High School has no passing rate for 4th grade math and 39% of the students are economically disadvantaged. It has a class size of 34 students and 75% of its students graduate with 95.2% going to college.
Students have a better chance of going to college if the quality of the education received in high school support their endeavors to continue with higher education. Quality education is supported by several factors. This analysis shows that larger class sizes lead to more students attending college. This may be because students can support each other or students flock to schools with better ratings or the students who have an advantage economically are more likely to go to a school that better supports their students and then on to college.
Massachusetts School System
The state of Massachusetts School System has districts that are distinctly disadvantaged students and districts of advantaged students. Most of the funding and support goes to the schools of advantaged students. This results in higher graduation rates, higher numbers of students going to college, and more students.
The two schools that show the opposing extremes of the spectrum are:
- Groton Dunstable Regional
- Springfield High School
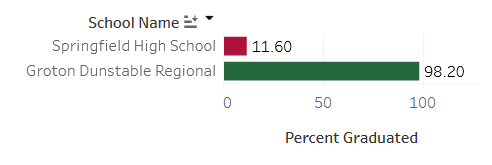
Groton Dunstable Regional is a public school with 846 students, 3.1% of which are disadvantaged. Its class size is 17 students with 98.2% graduating and 89.7% going to college.
Springfield High School is a public school with 101 students, 88% are disadvantaged. Its class size is 7 students with 11.6% graduating and 58.8% going to college.
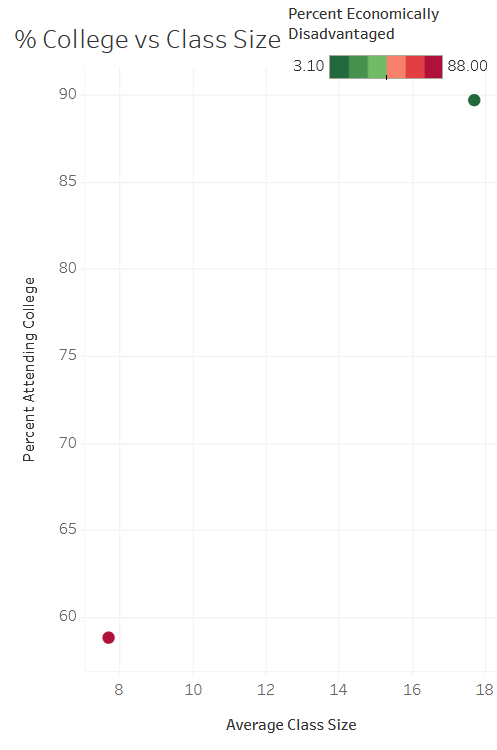
Groton Dunstable Regional has impressive ratings and almost all of their graduates go to college. It is a good school for students who have intentions of higher education. Springfield High School has more disadvantaged students, less students, and a lower college rate. This school shows signs of needing more funding and support to better prepare more students for college as well as providing more resources to assist those looking to attend and go on to college.
Key Insights for School/Education System
The following educational insights for Massachusetts School System are advised to increase their ratings and student numbers:
- The bottom 10 schools and the districts they are in should receive more support, funding, and teaching incentives to improve the school, its teachers, and the quality of education
- Scholarships and fully funded education should be offered to students who are disadvantaged to give them a good education and a better chance at college
- The policies and decisions that support districts with higher ratings should be evaluated and applied to other school districts
- Schools with larger class sizes have more students going to college after graduating
To conclude, Massachusetts bottom 10 schools contain 3 public schools from Springfield district. Also public schools are the top math schools in the state. In Massachusetts, bigger class sizes results in more students going to college. In opposition to this correlation, more disadvantaged students mean less students and lower rates while less disadvantaged students mean more students and higher rates.
In addition, educational insights are provided to increase students and ratings. Schools with more disadvantaged students should be given more support to improve.
Thanks for reading! If you have any questions, please email me at the email below. Also, I am looking for a full-time remote job as a data analyst, so if you have any recommendations, please message me on LinkedIn or email me at xaviertquinn@gmail.com. Any information would be very helpful!